Lots of data, no signal

Overview

A few clients came to me with lots of data, a lot of noise and little actionable signal. Payments, Google Analytics, CRM and email, all recording everything, and no idea which numbers actually mattered.

So I designed and built a solution that combined all the data in one place.

Goal

  • Uncover blindspots in data from leadership (the stuff that's actually useful)

  • Deliver insights the team can act on using story-telling format (instead of another dashboard)

  • Use AI where it makes sense; analysing the data to bring focus to specific problem areas

Role

Design, prototype and build

Outcome

  • Using some of the intel to implement improvements, Reading Rep saw a 43% increase in revenue

  • Deep data analysis surfaced validated insights like when people tend to book, when they renew membership and more.

Scope

Prototyping

UI

Branding

Conversion optimisation

Strategy

Design systems

Product design

Why dashboard don't fix the issue

The most useful insight holds three things. What happened (the numbers), why (the analysis and behaviour), and the action (what to do about it).

Generic dashboards in each tool use generic charts, and disconnected numbers that often don't tell the full story.

They say; here's some data, good luck.

I started by asking leadership about known blindspots

Blindspots helped uncover the starter questions:

  • What did we sell this month?

  • Who's booking?

  • Is the booking flow holding up?

  • Which shows worked and which didn't?

  • What should we do about any of it?

Each section answers one question with the smallest set of numbers visualised (because every data point shown increases noise and reduces signal).

NB no real client data is being used below.

The top-line

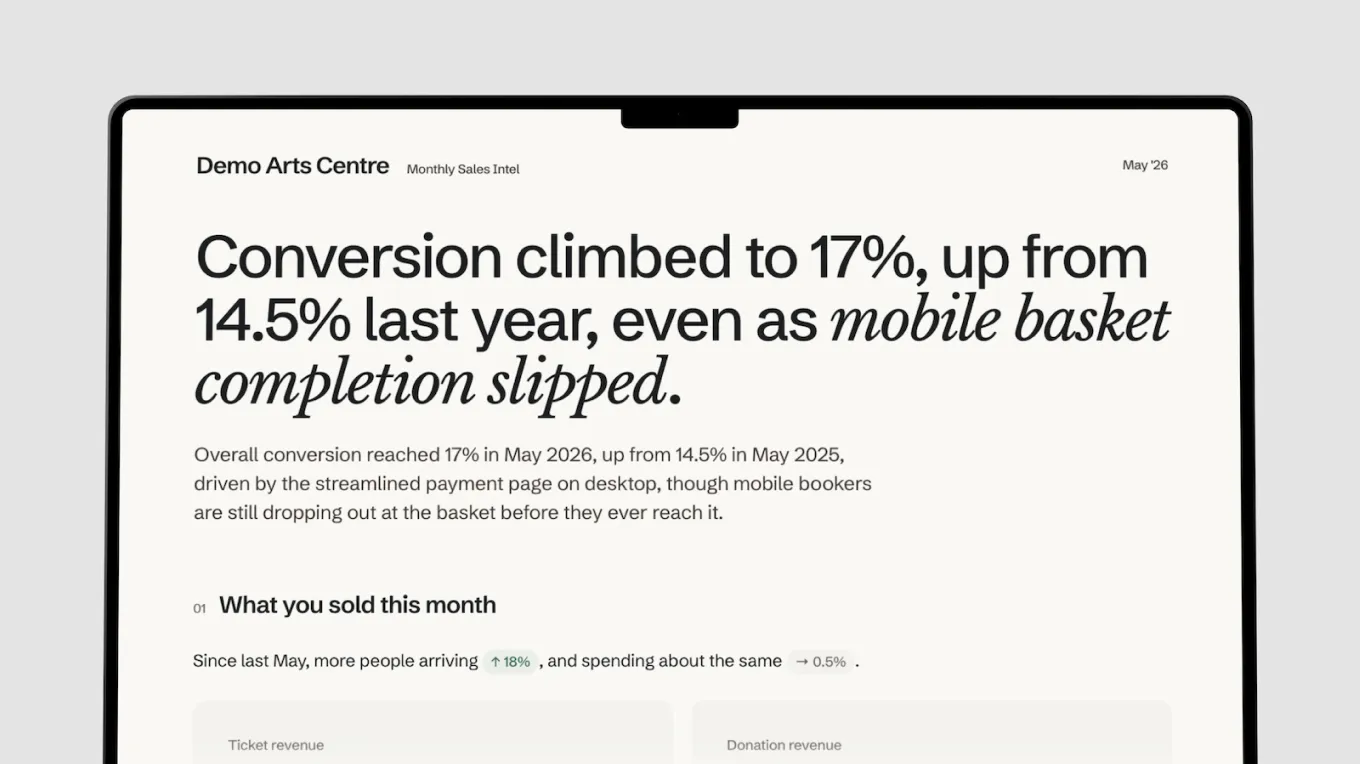
A snapshot surfacing the biggest thing that month, mostly to build the narrative, set the scene and draw in the reader.
How's business

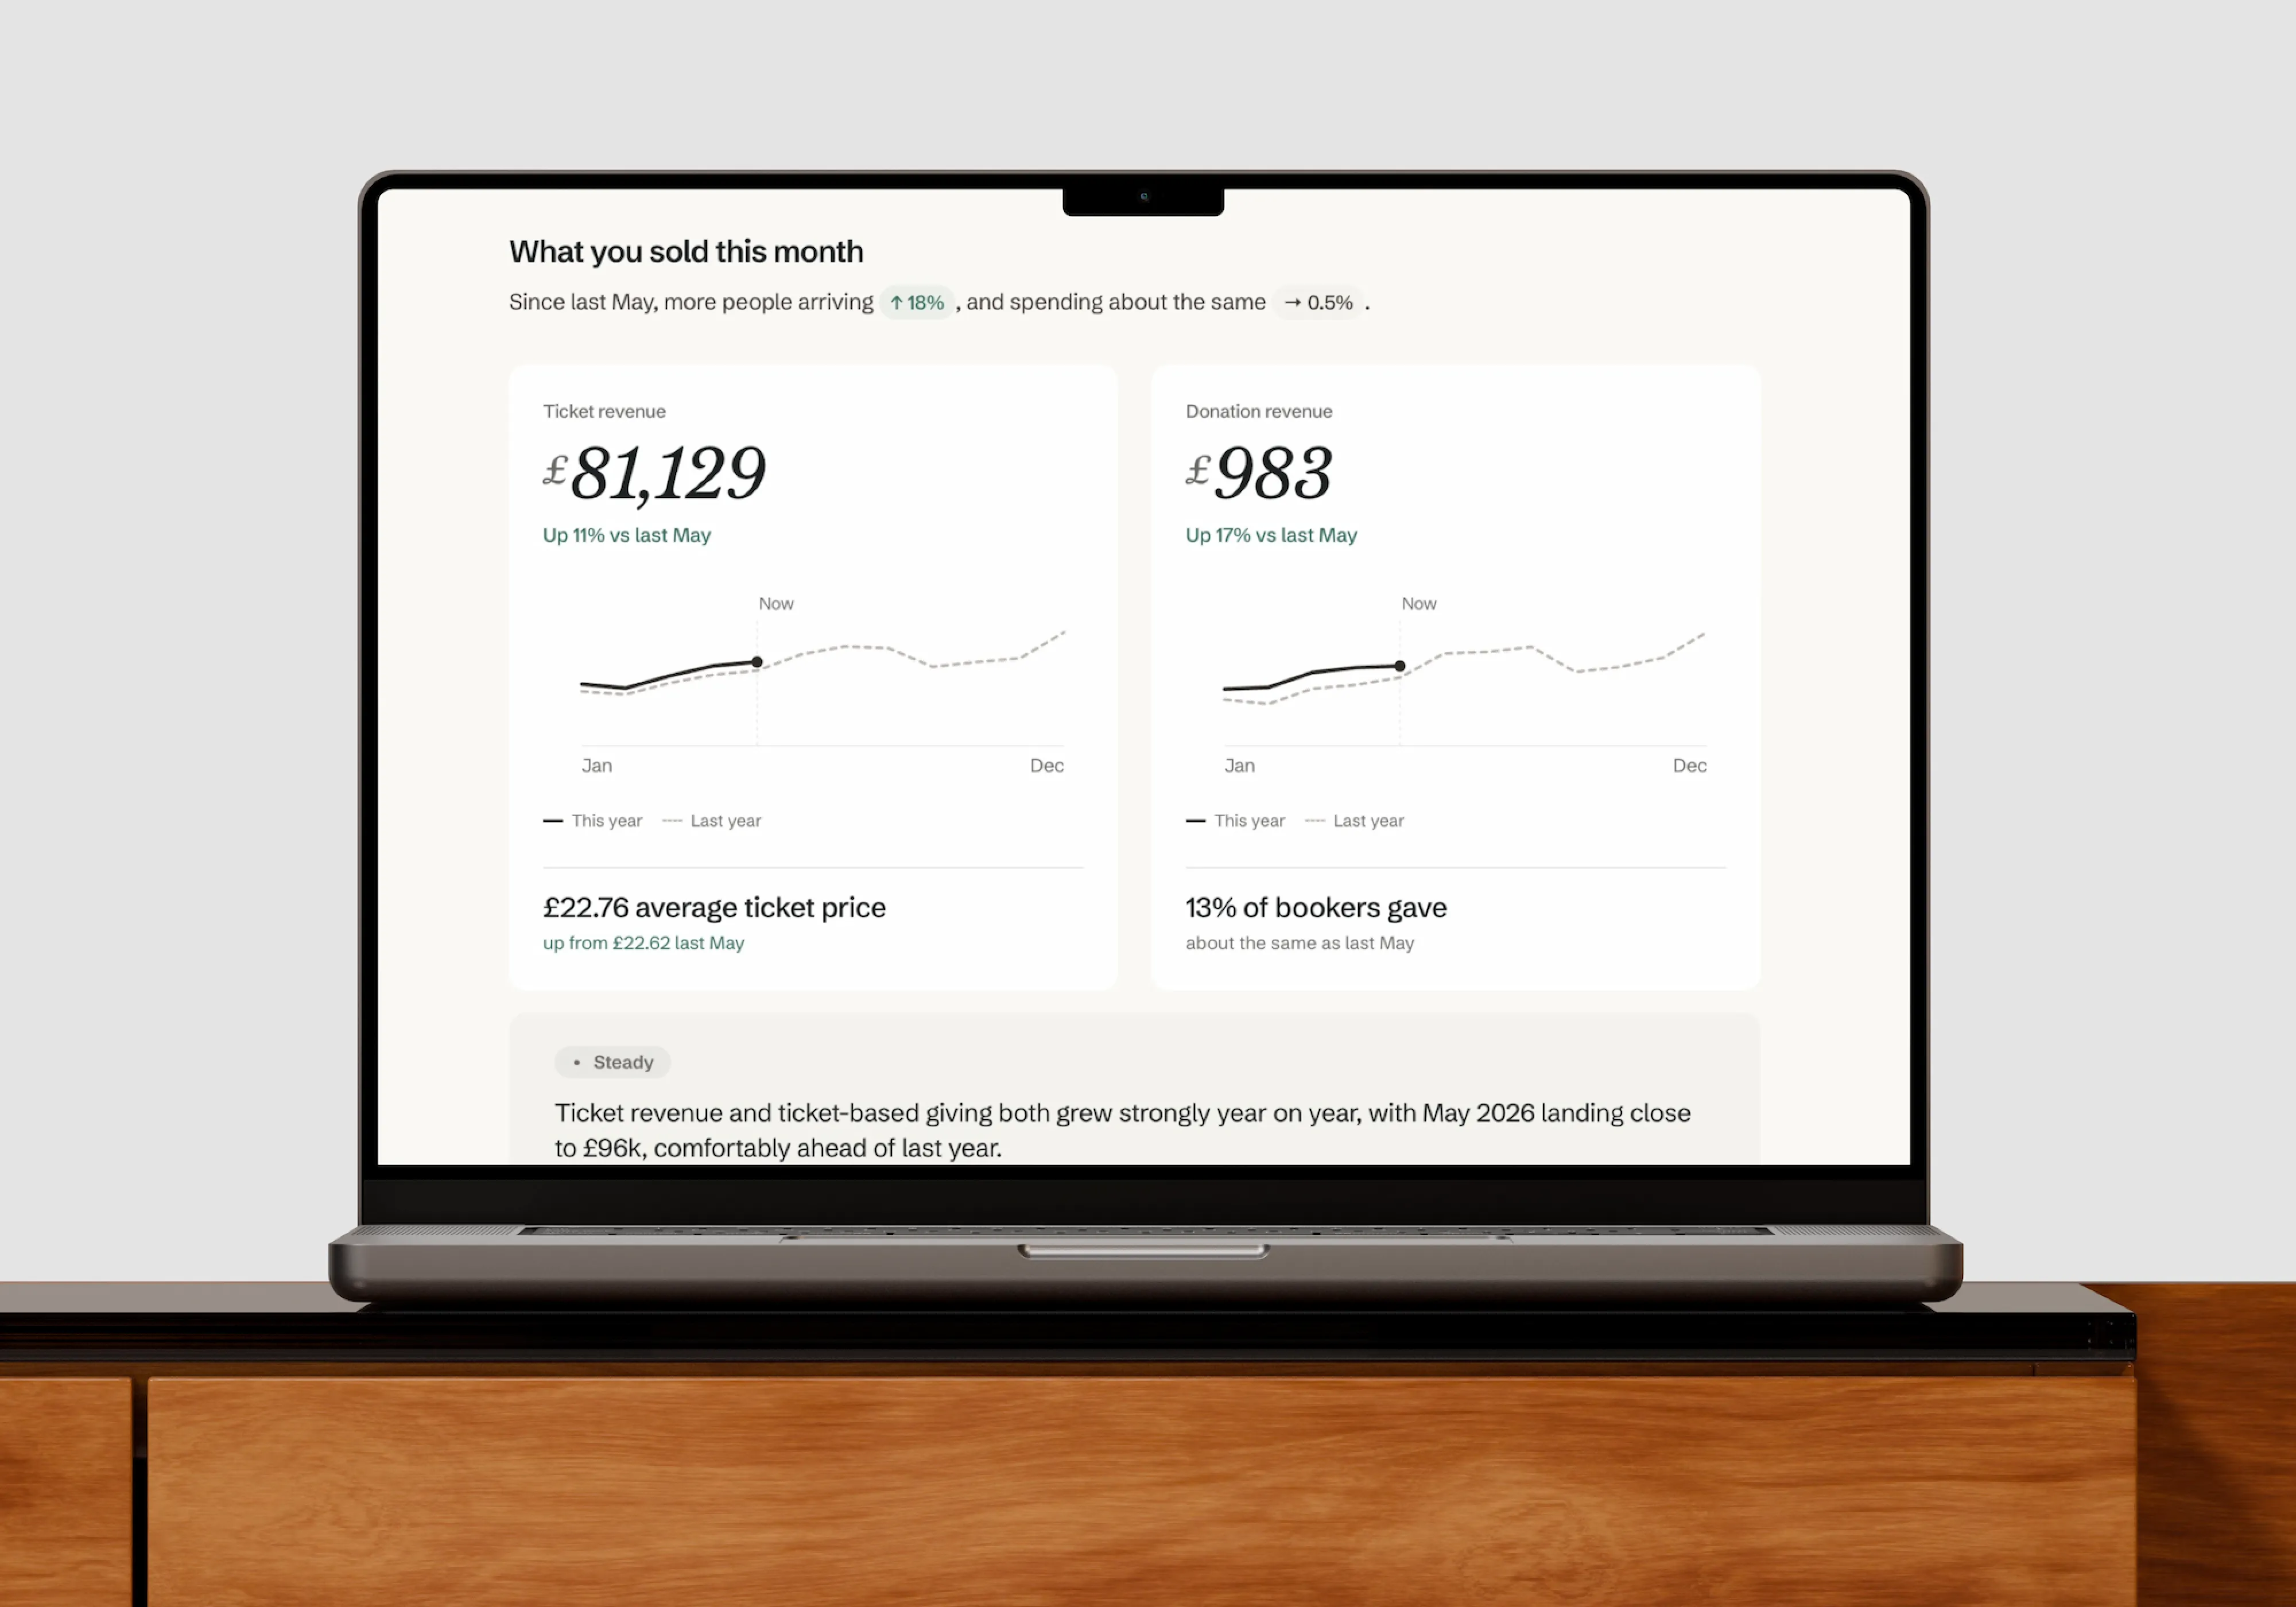
In the case of clients selling tickets, revenue and donations are the headline figures. So we lead with them, along with a trend. These venues are seasonal so upticks during the Christmas period are common. The benchmarks are mostly YoY for this reason.

Revenue grew year on year and held to its usual pattern, so no decision falls out of it. The report says that plainly and moves on, rather than asking you to work it out from a chart.

Who's booking?

Are we capturing more customers? Are they coming back, and how quickly? All within the context of previous period performances.
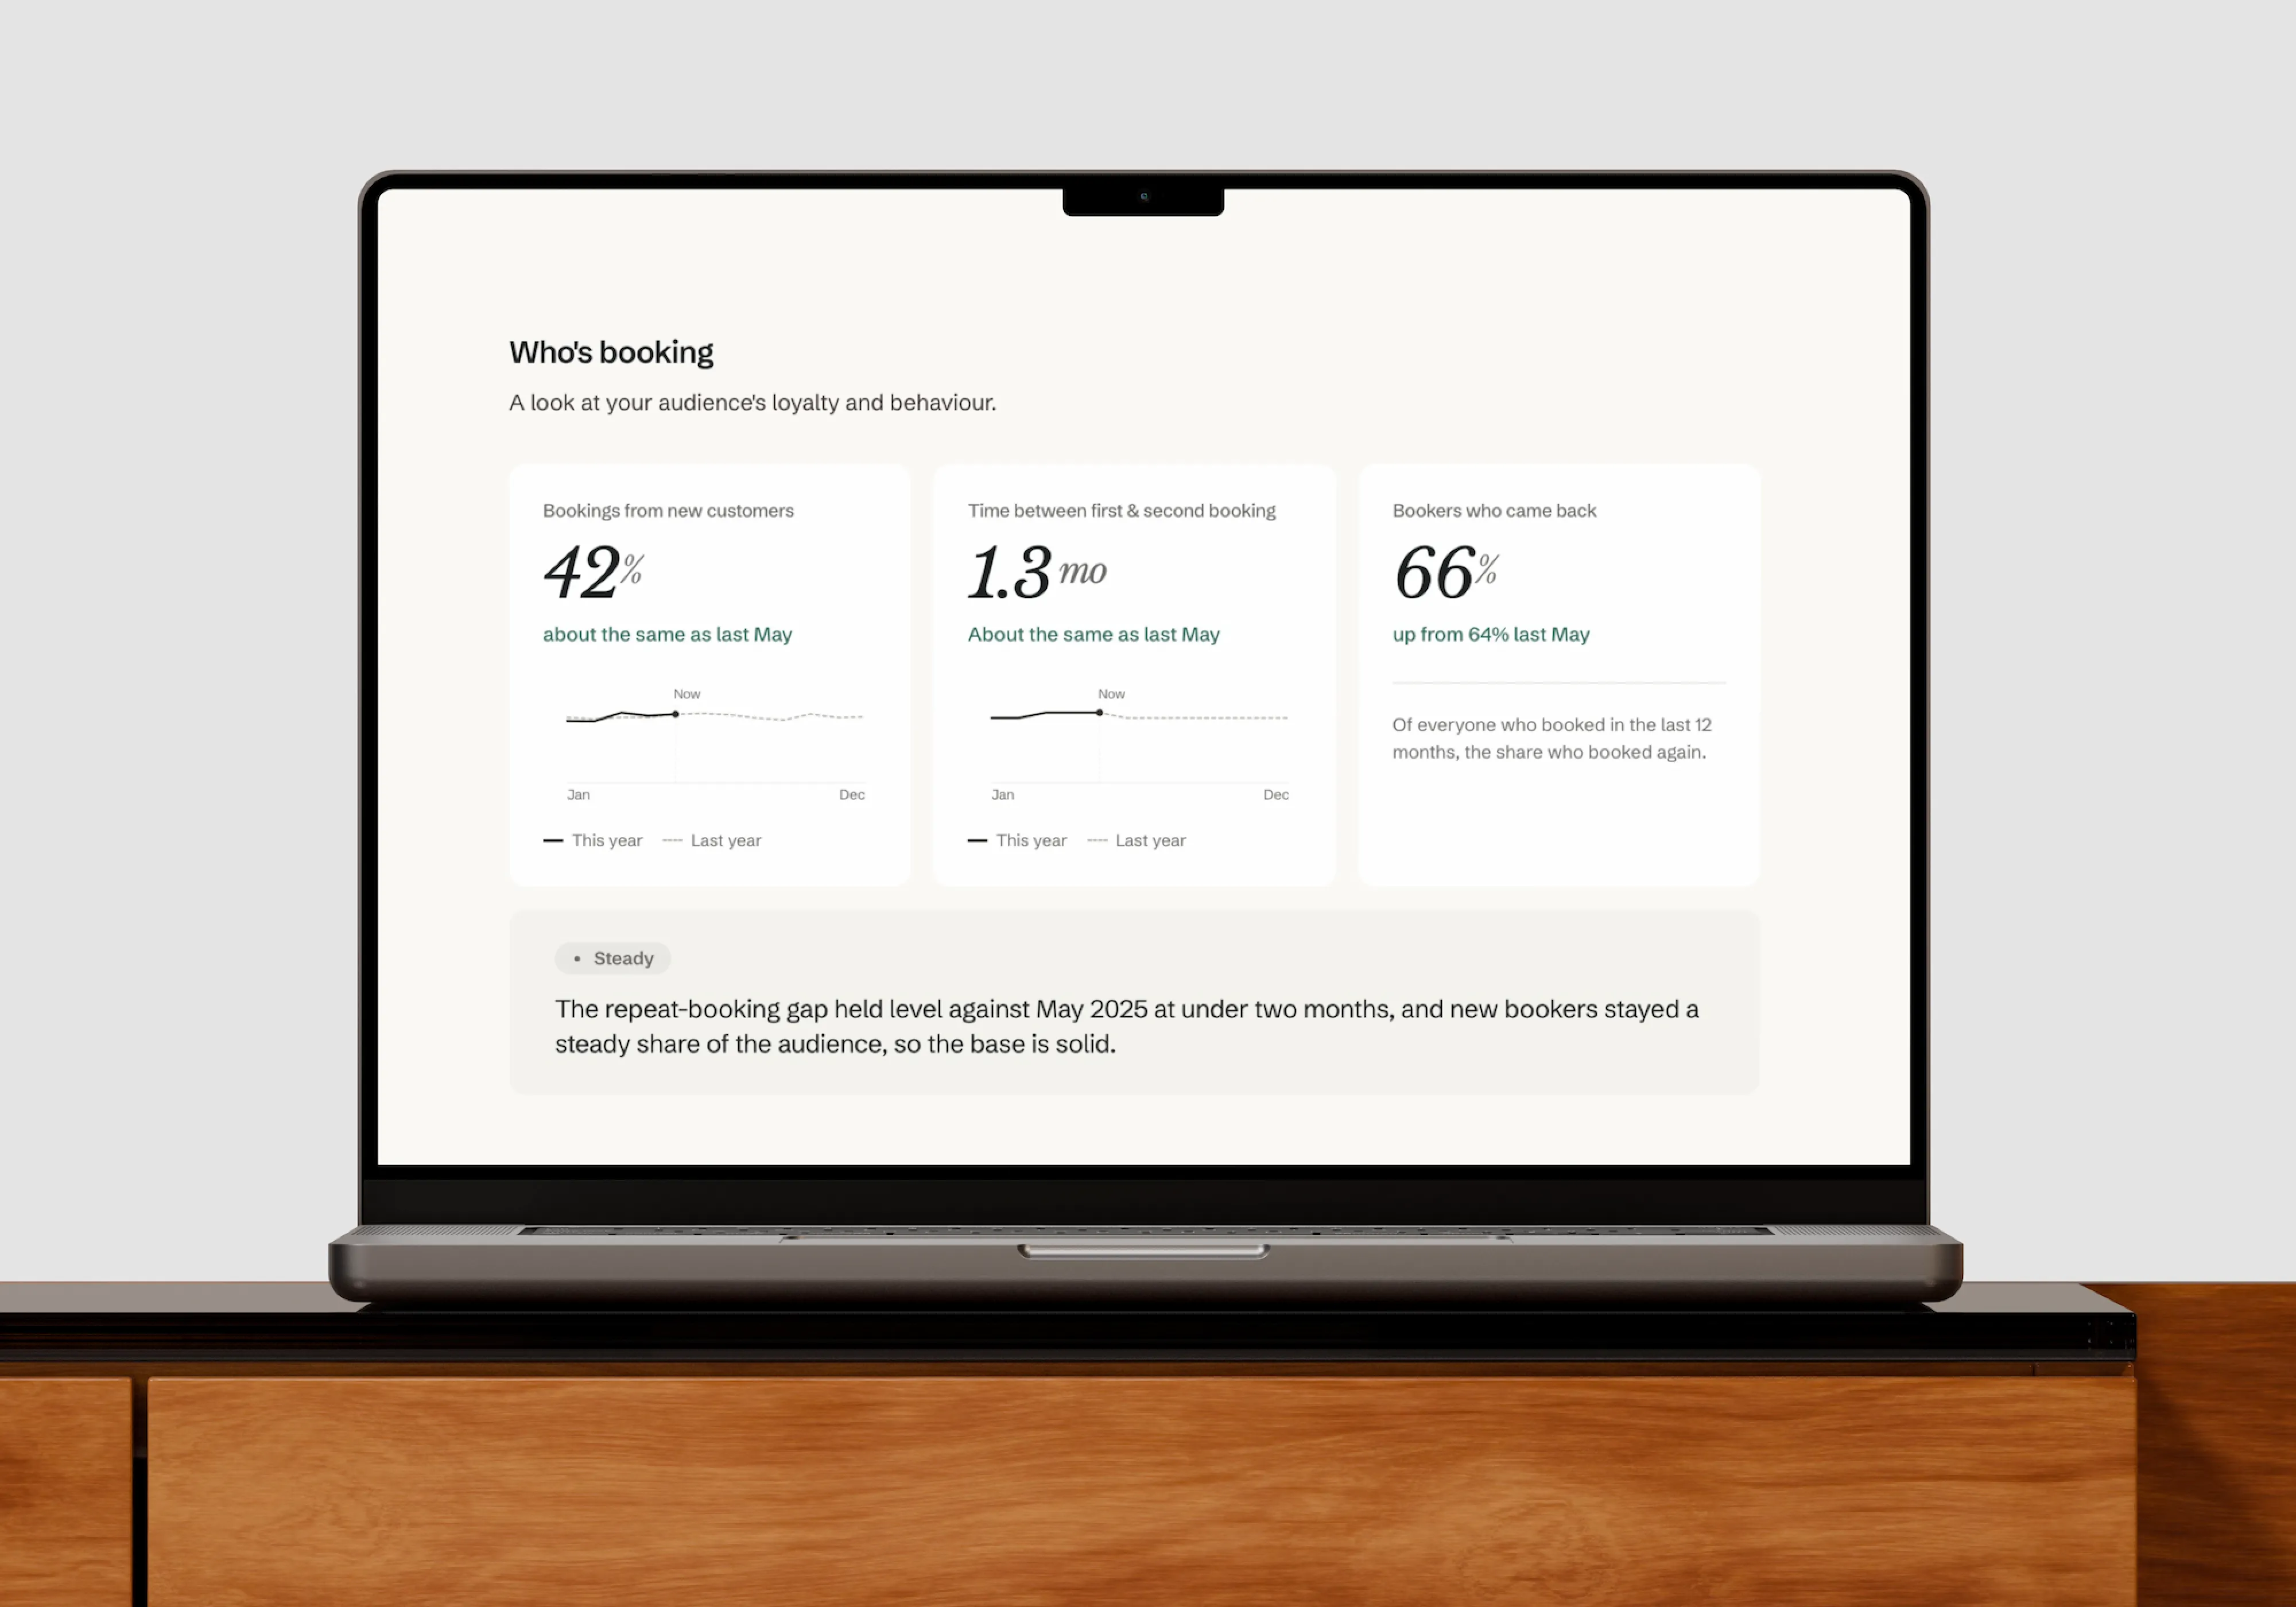
Here we can see new bookers and repeat timing both held against last May, so the base is solid and there's nothing to act on.

Booking flow performance

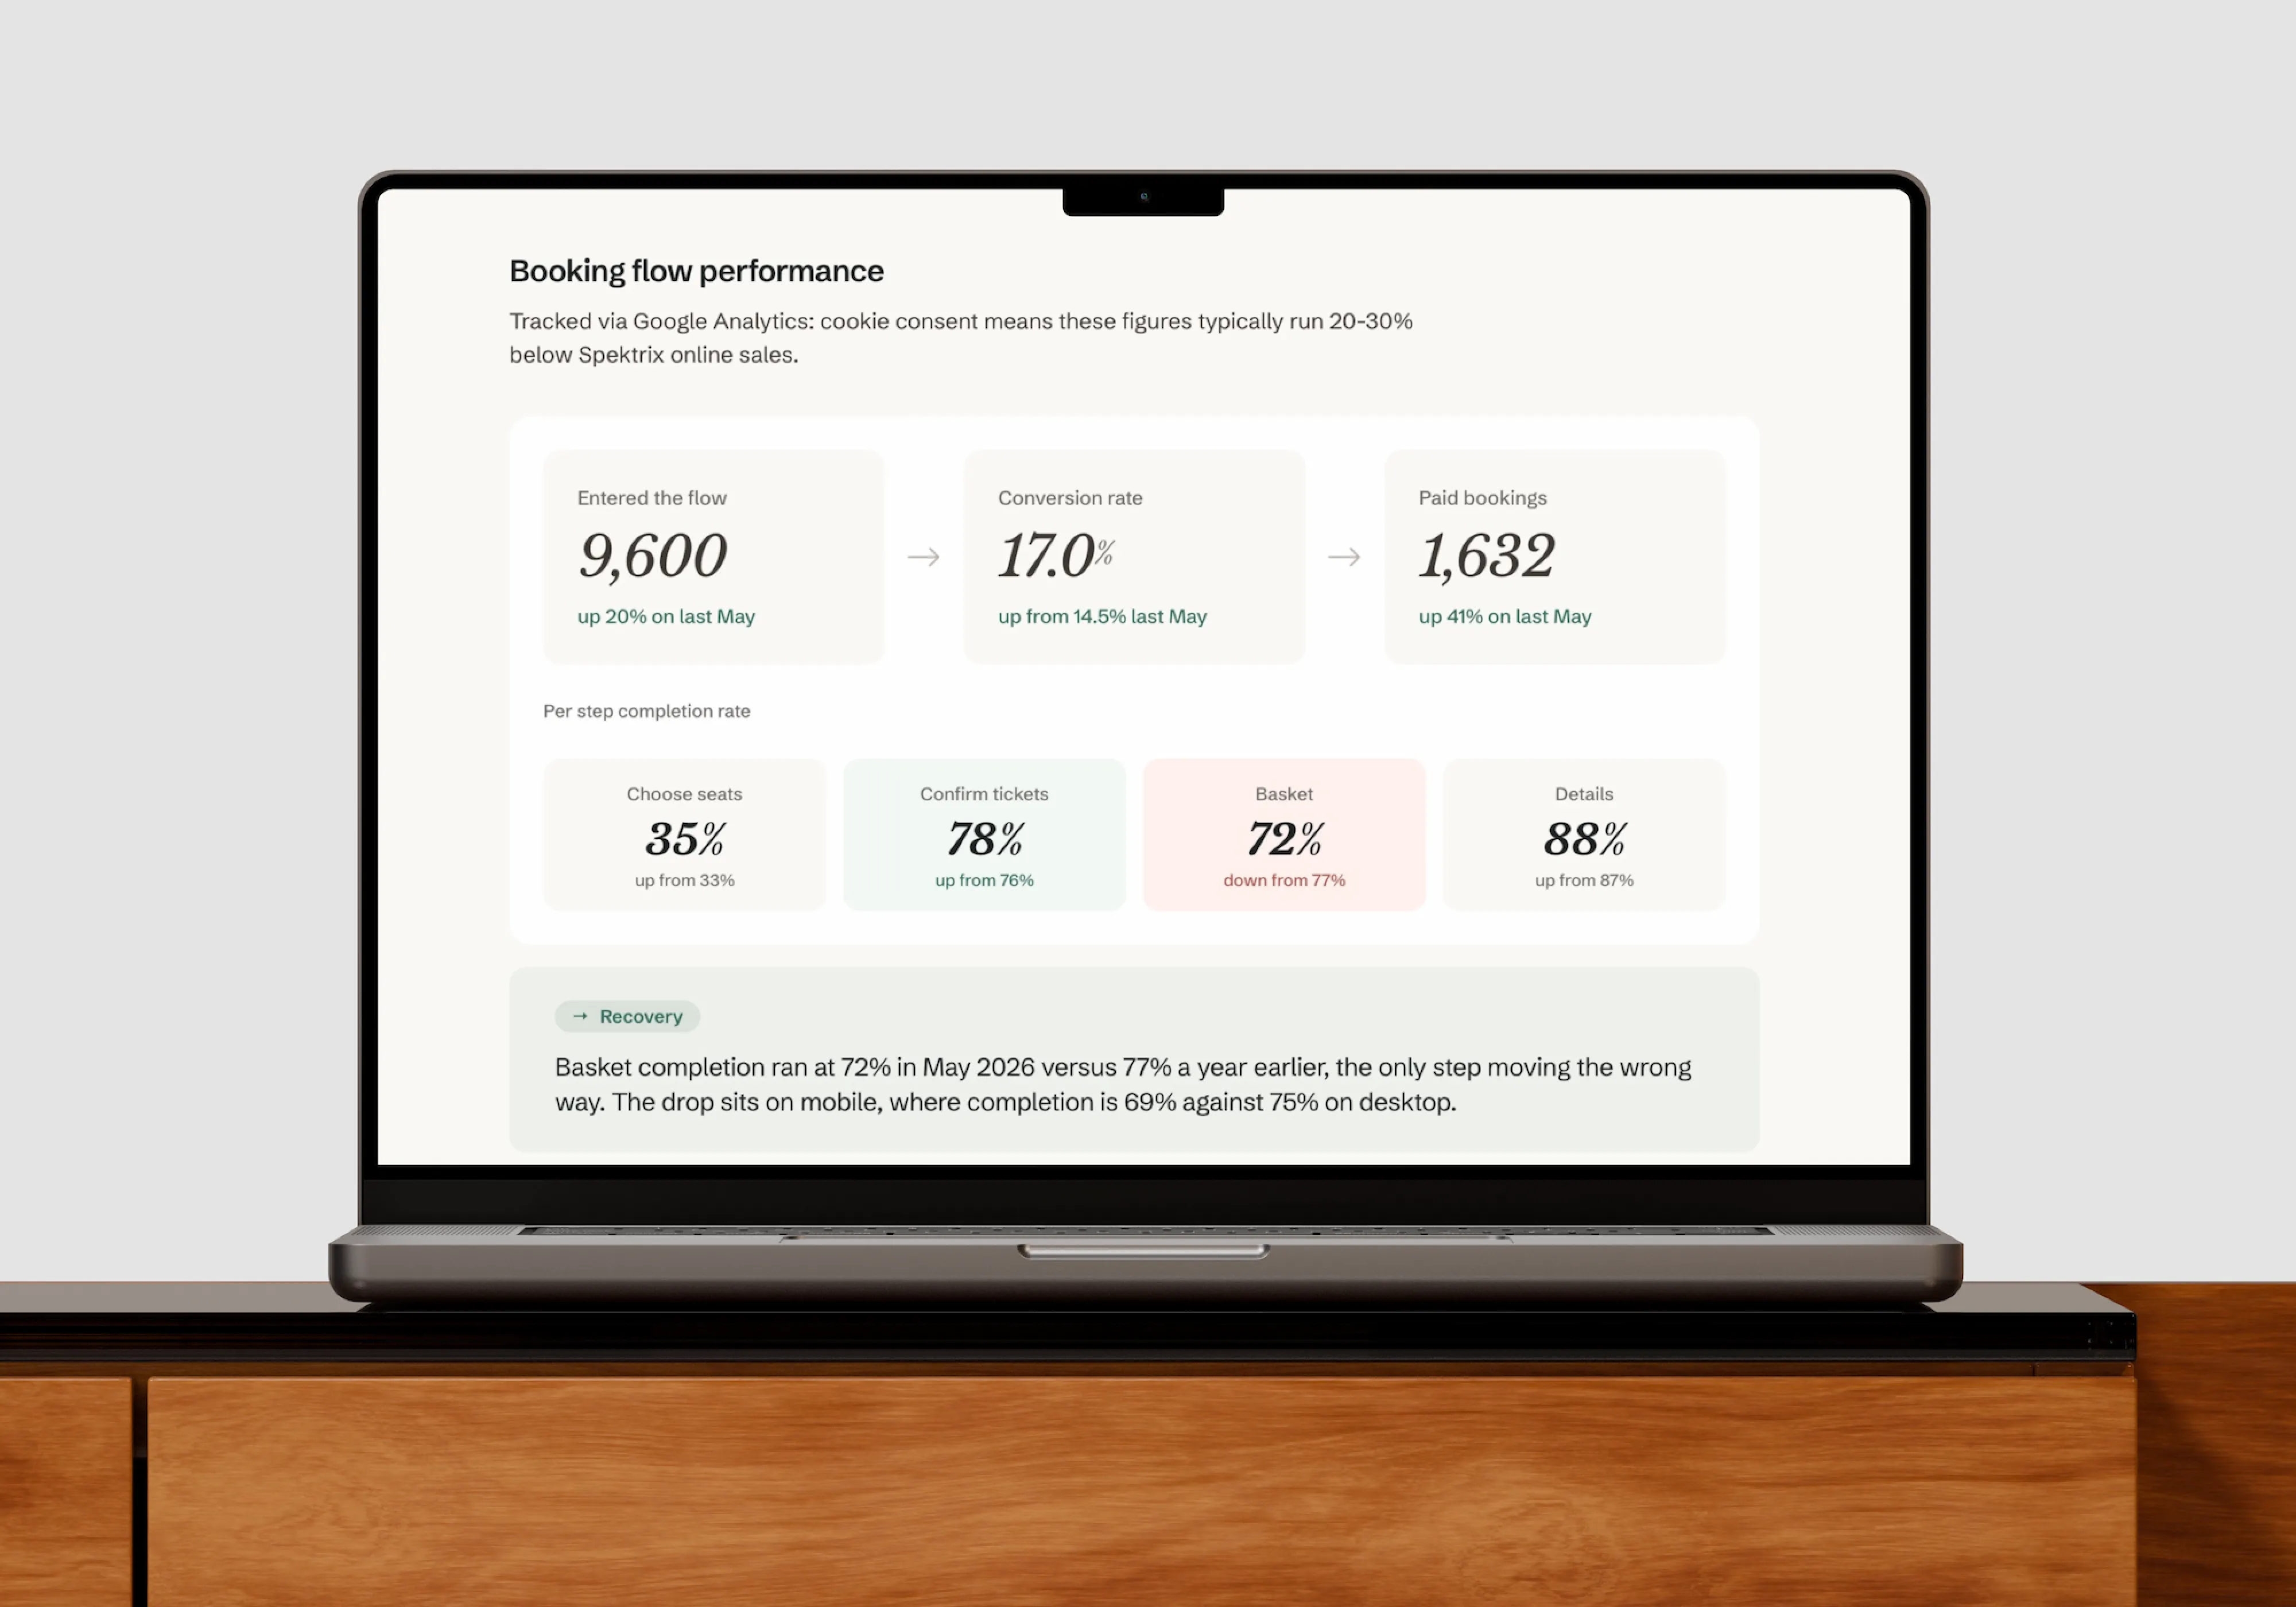
The flow section is where the first thing worth acting on shows up. Overall conversion climbed to 17% from 14.5% a year earlier, which reads as good news but isn't the signal. The signal is one step inside it: basket completion ran at 72% against 77% last year, the only step moving the wrong way, concentrated on mobile.

Show by show insights

To answer 'what shows are returning most revenue'. We rank each run against the venue's typical range. This section provides a huge tactical advantage when planning programming for future seasons.
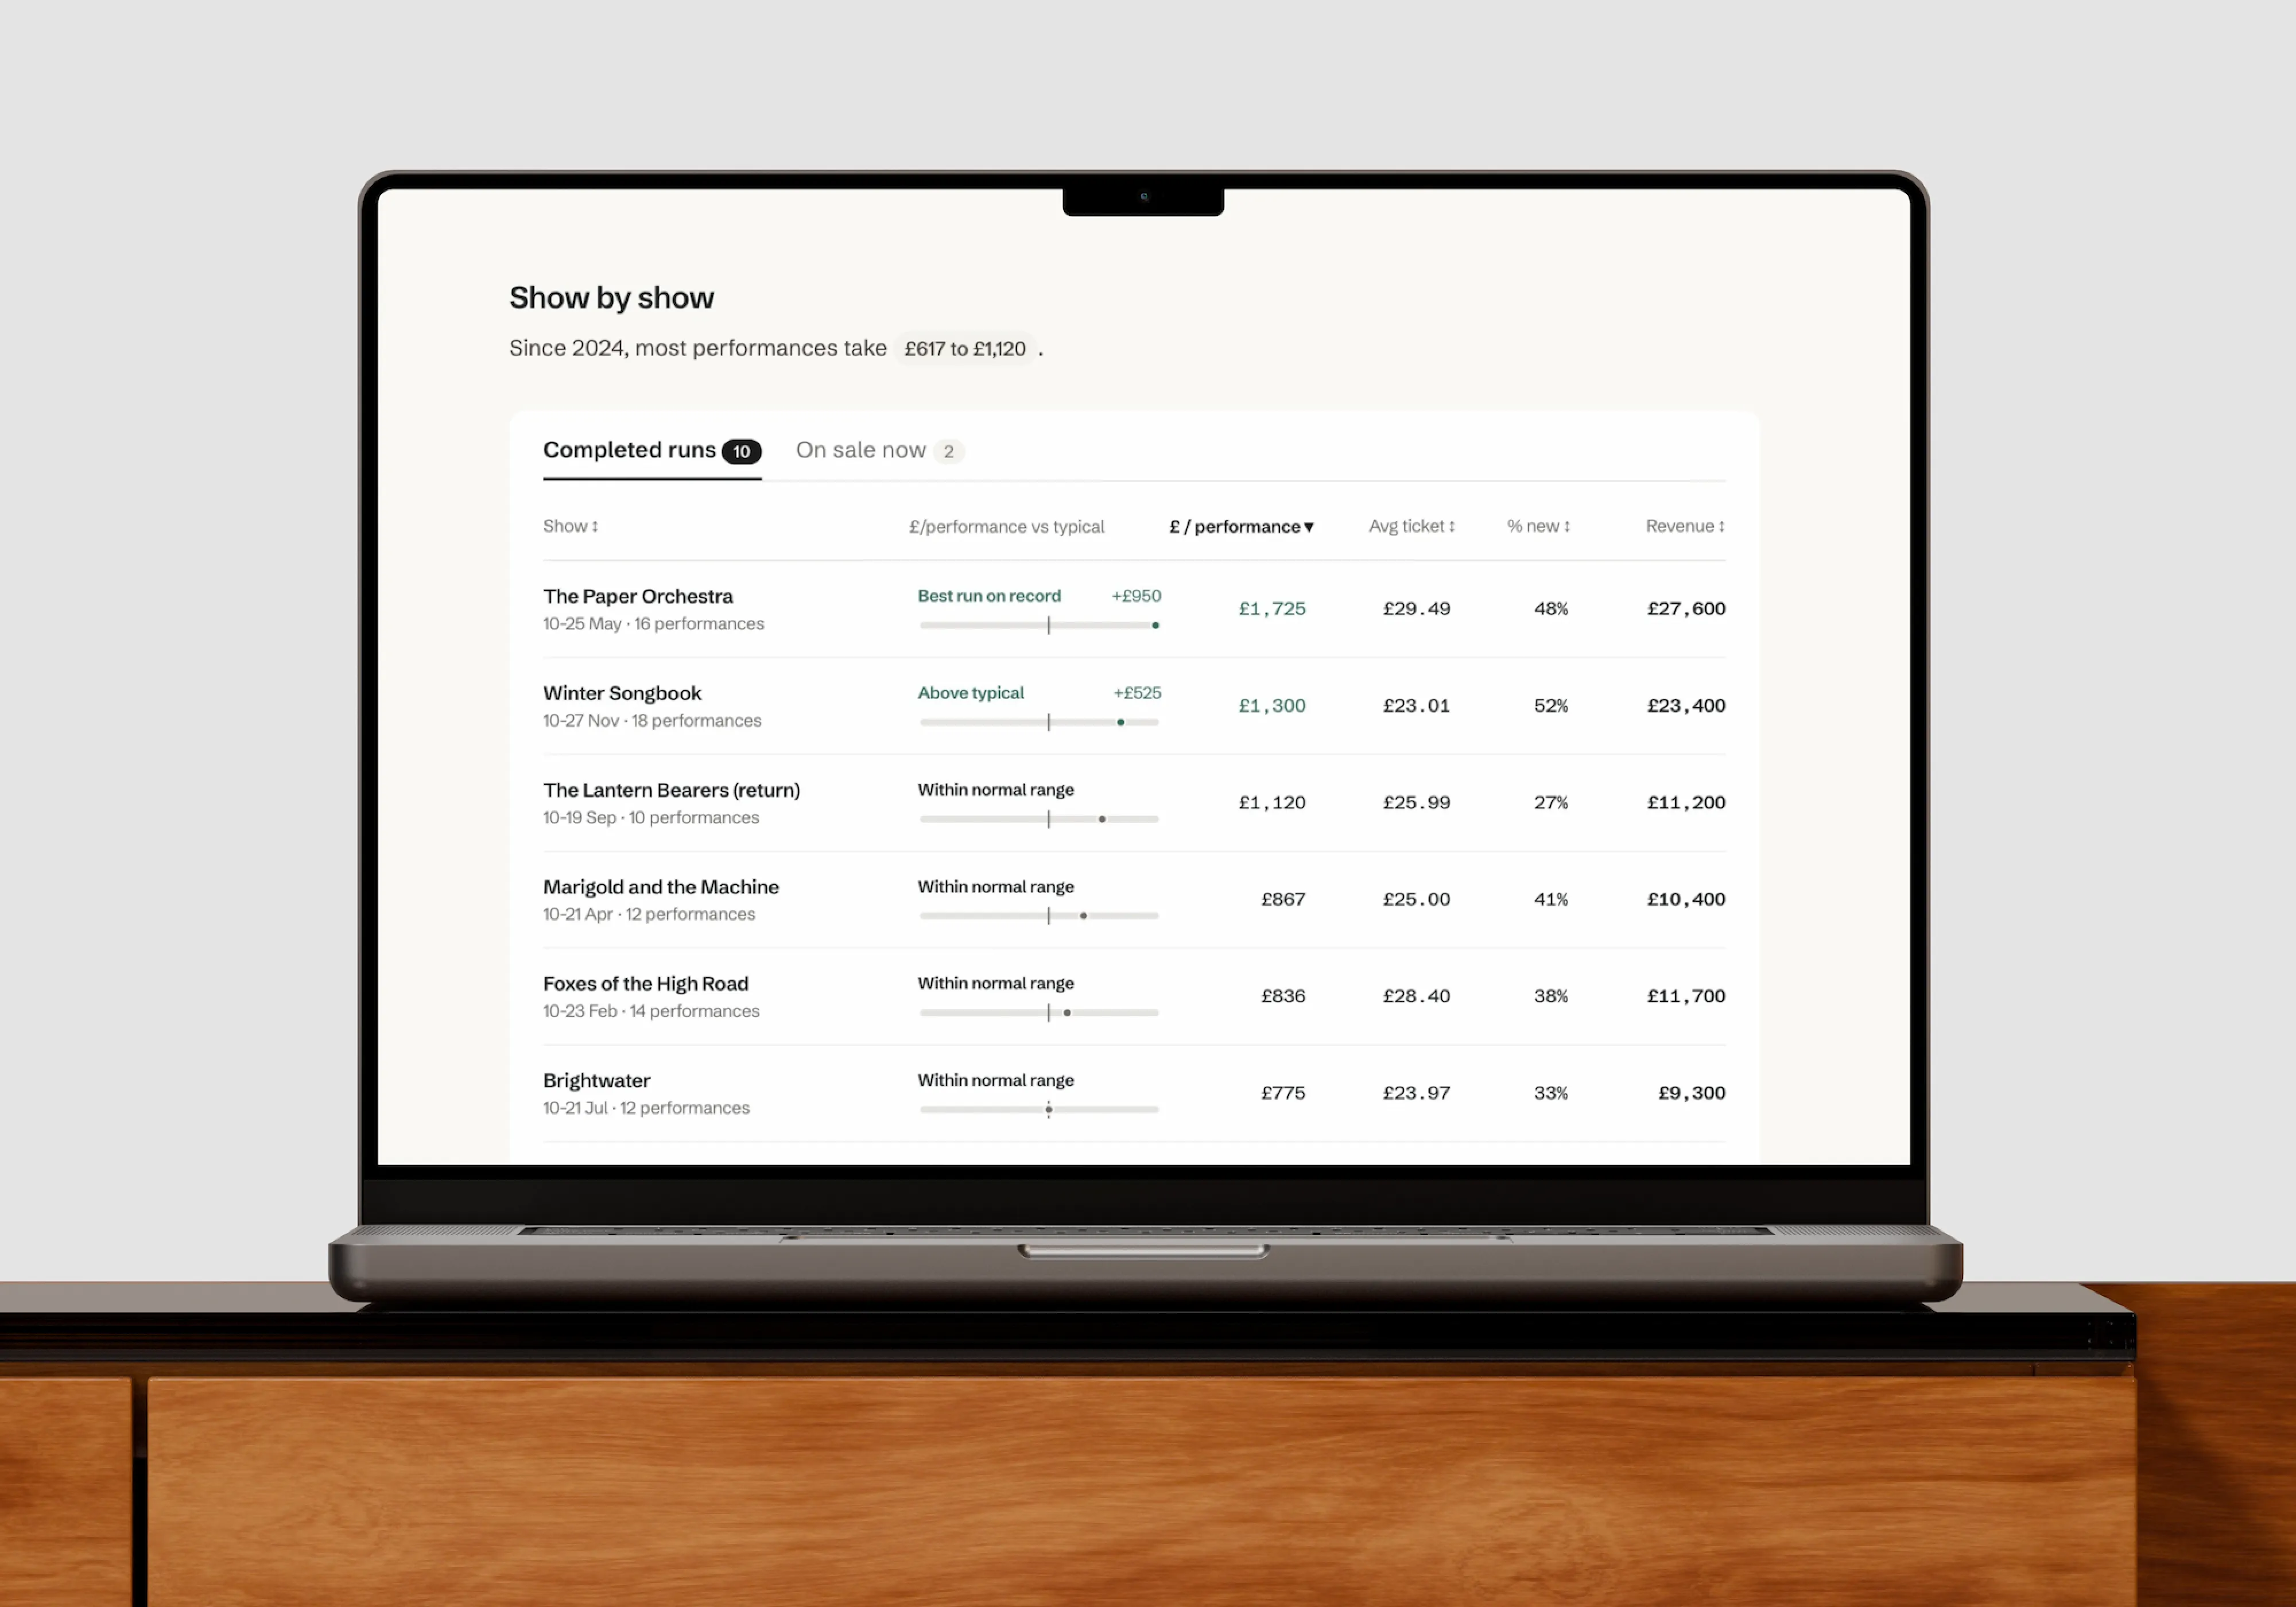
One new question surfaced here that we'll fold in next: which types of show are pulling in new audiences? This is how to sharpen insight over time.

Turning insight into action

Every month ends here. I take the biggest opportunity surfaced and turn it into a hypothesis to test, with a simple pathway to approve the test.
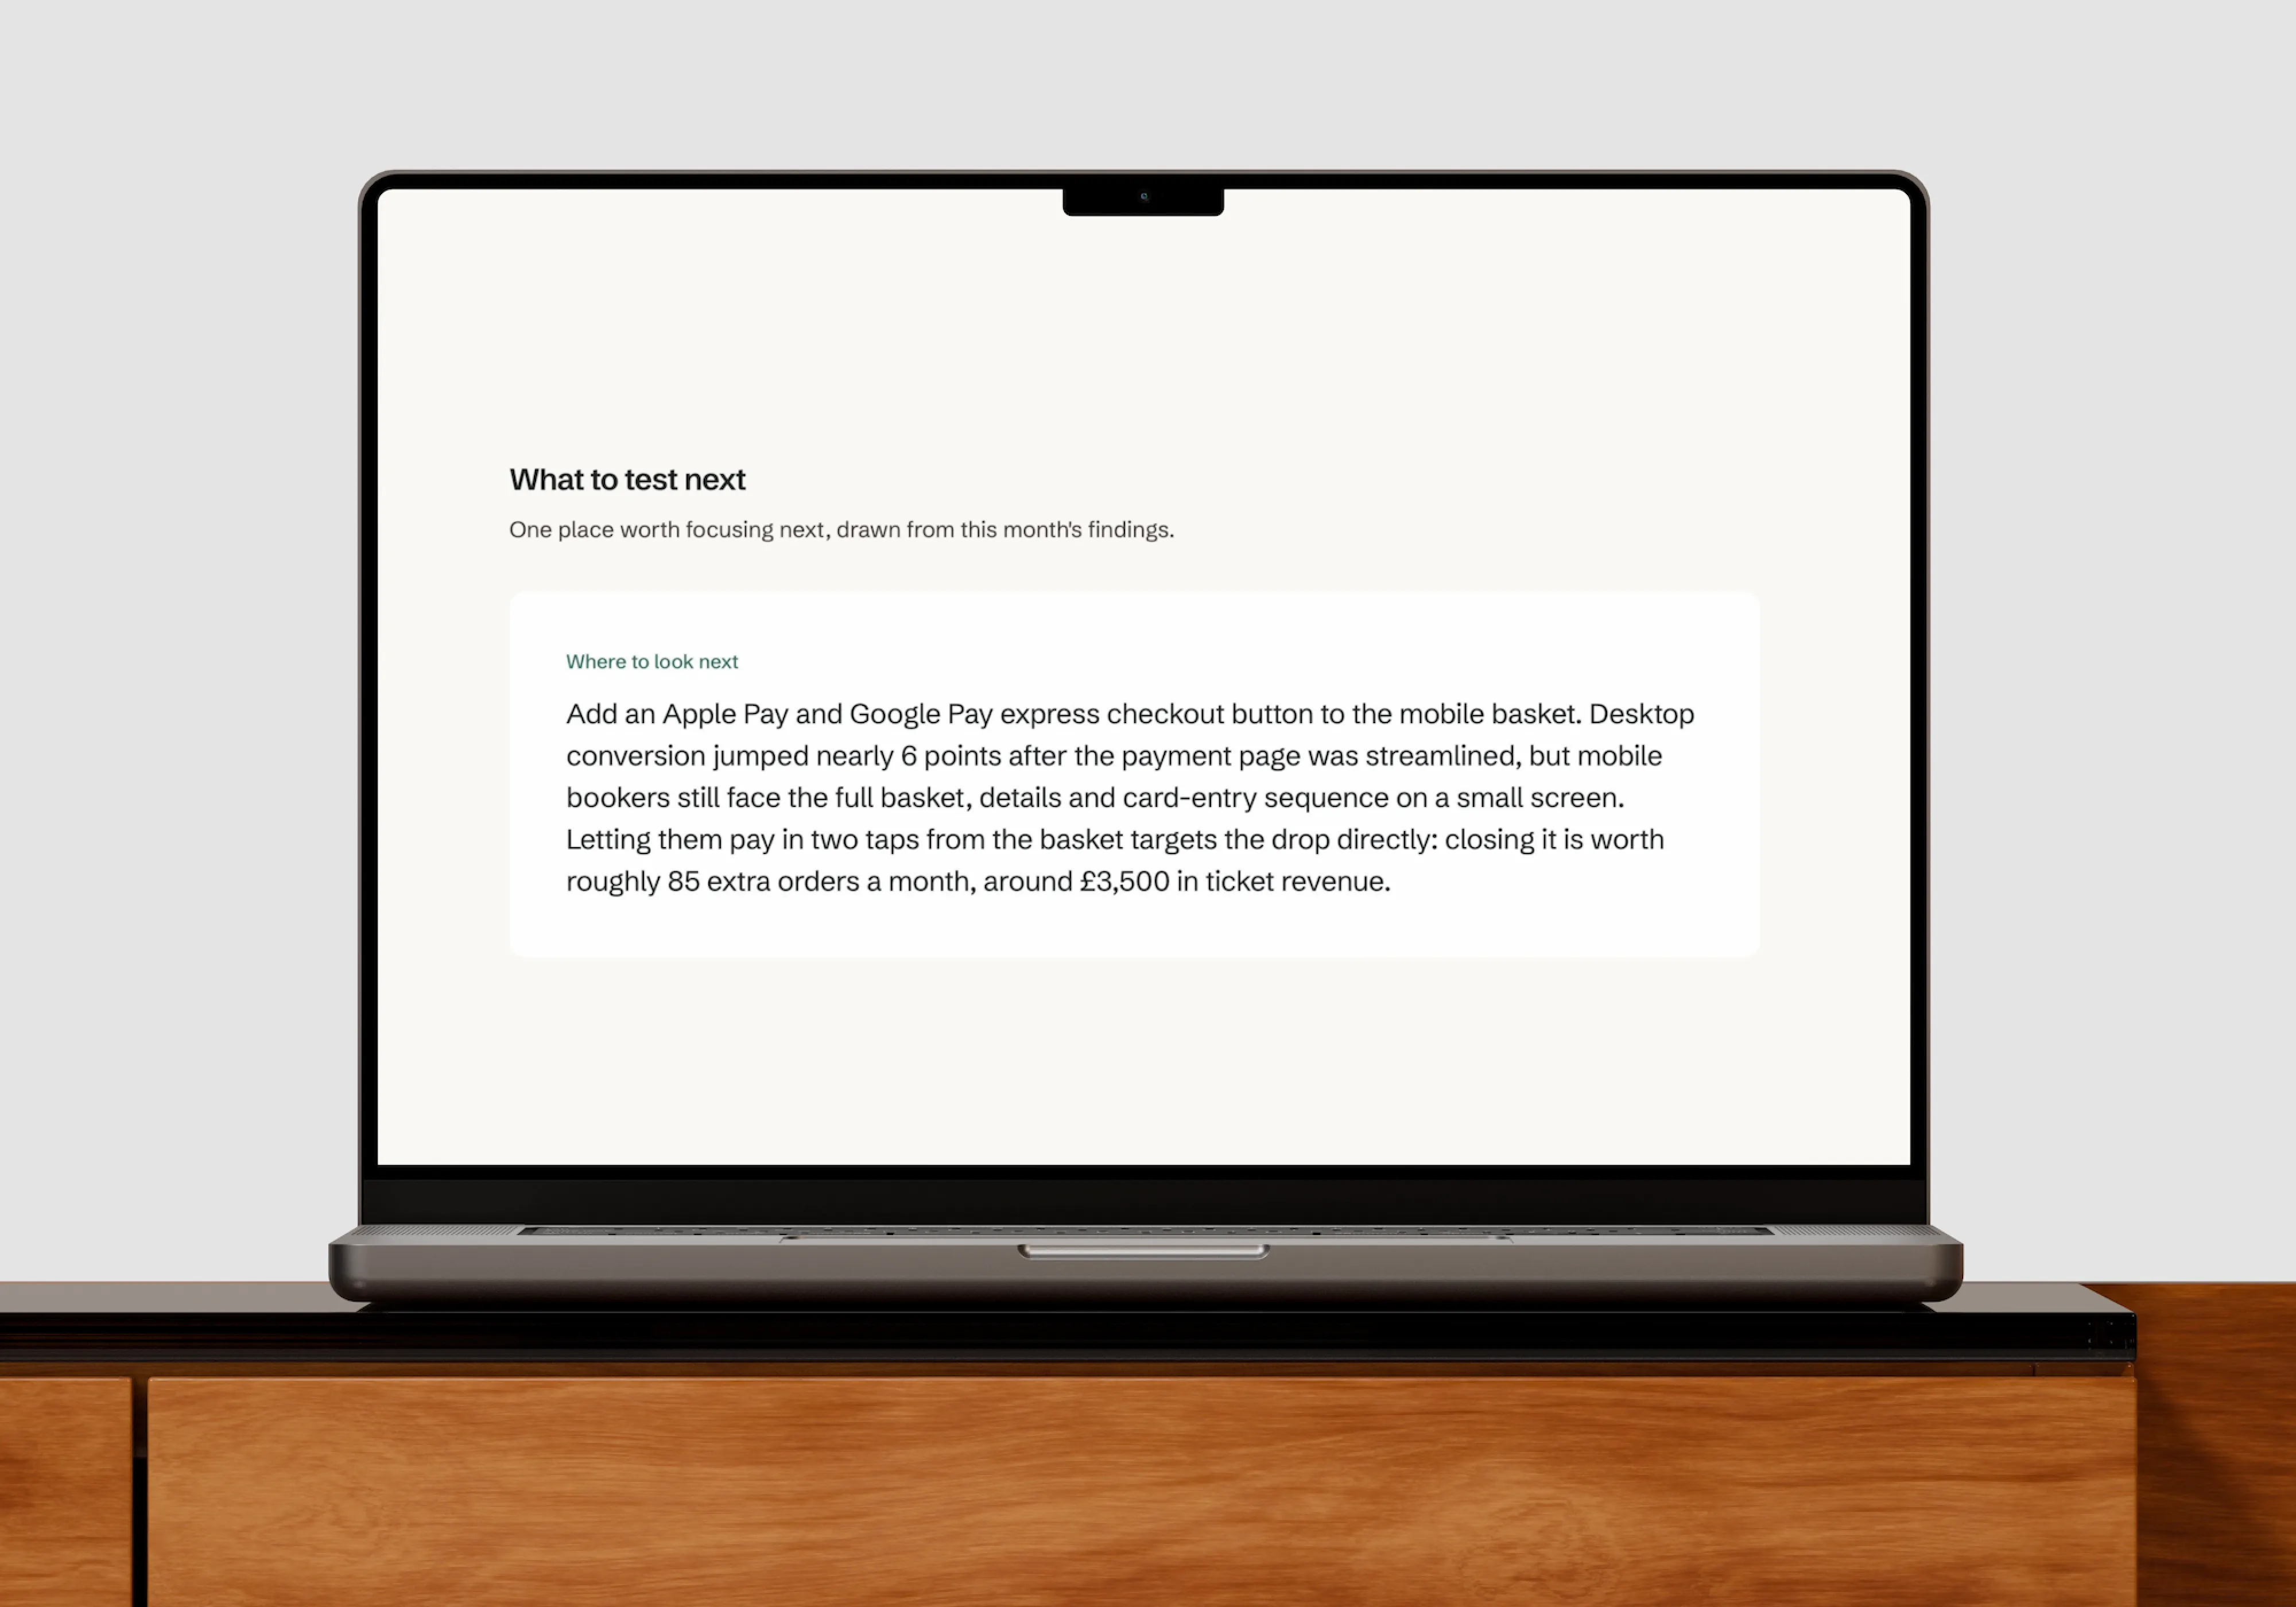
The next step would be looking at behaviour recordings to see if the on site user behaviour aligned with this hypothesis. If it does, we'd ship the express button, record the change in the report's memory and track movement over future months.

Handing over signal, instead of just data

The solution I came to is surfacing less, not more. Asking what questions they need answered, what blindspots they're feeling, then combining their data sources into one monthly narrative that ends in an action. The hard part sits well away from the charting. It's hiding the noise, finding the blindspots, and sharpening the questions month on month as the team tells me what they actually need.

I'd rather send something that ends in a decision than another dashboard to ignore.

Got an idea you want prototyped?

Book a call with Chris and let's discuss your idea!

chris@caboodle.studio

Copied

©2026 Caboodle Digital Ltd

London, UK N1 7SR

CRN 10034635 VAT GB234288795

©2026 Caboodle Digital Ltd

London, UK N1 7SR

CRN 10034635 VAT GB234288795